It is very important that we put a "human face" on the data. These are not numbers - these are children!
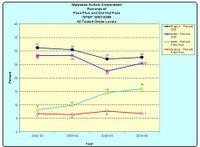
The top two lines going down tell us that 126 fewer students were in the Did Not Pass category. This means there were 126 additional Wawasee students who achieved proficiency levels in Math and English, that might not have done so in 2002 when the data was first gathered. That is over 5 CLASSROOMS full of students!
The line moving upwards shows that the number of students in the top 10% of the state in Mathematics has doubled since 2002. This means there are 167 additional students scoring in the highest 10% in the state of Indiana in Math. That is 7 MORE classrooms full of students that are in the top 10% of the state that weren't there in 2002. The red line shows there is no change in corporation totals for students scoring in the top 10% in Language.
That my friends, is the student side of the data.


No comments:
Post a Comment